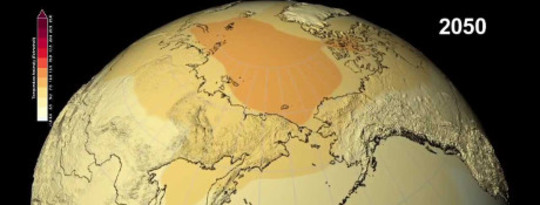
New data visualizations from the NASA Center for Climate Simulation and NASA's Scientific Visualization Studio show how climate models - those used in the new report from the United Nations' Intergovernmental Panel on Climate Change (IPCC) - estimate how temperature and precipitation patterns could change throughout the 21st century.
For the IPCC's Physical Science Basis and Summary for Policymakers reports, scientists referenced an international climate modeling effort to study how the Earth might respond to four different scenarios of how much carbon dioxide and other greenhouse gases would be emitted into the atmosphere throughout the 21st century. The Summary for Policymakers, the first official piece of the group's Fifth Assessment Report, was released Fri., Sept. 27.
That modeling effort, called the Coupled Model Intercomparison Project Phase 5 (CMIP5), includes dozens of climate models from institutions around the world, including from NASA's Goddard Institute for Space Studies.
To produce visualizations that show temperature and precipitation changes similar to those included in the IPCC report, the NASA Center for Climate Simulation calculated mean model results for each of the four emissions scenarios. The final products are visual representations how much temperature and precipitation patterns would change through 2100 compared to the historical average from the end of the 20th century. The changes shown compare the model projections to the average temperature and precipitation benchmarks observed from 1971-2000. This baseline is different from the IPCC report, which uses a 1986-2005 baseline. Because the reference period from 1986-2005 was slightly warmer than 1971-2000, the visualizations are slightly different than those in the report, even though the same model data is used.
{youtube}d-nI8MByIL8{/youtube}