
A common argument for the decline in employment in recent years is that more workers are dropping out of the labor force to live off public benefits, particularly Social Security Disability Insurance (SSDI). SSDI is a program that provides cash benefits and healthcare to former workers who become too disabled to continue at their jobs. The average benefit payment is about $15,000 per year, and workers must have an extensive work history in order to qualify.
While the percentage of the workforce receiving disability benefits has increased since 2000, much of this rise is simply due to demographics, most importantly the aging of the population.[1] Figure 1 shows the unadjusted SSDI beneficiary rate and a second rate that has been adjusted for the age and gender composition of the labor force. [2,3]
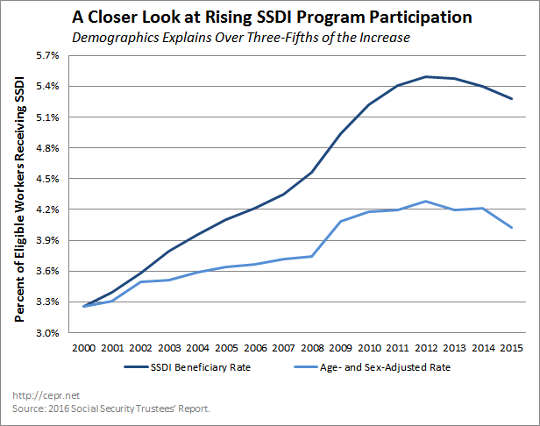 Figure 1
SSDI is actually one of two major programs benefiting disabled workers. The other is Workers’ Compensation (WC), a privately-run insurance system for workers who get injured at their jobs and are unable to continue working. While there are some differences between WC and SSDI, the two programs are broadly similar. Moreover, previous CEPR research indicates that they function as substitutes: when enrollment goes up for WC, it goes down for SSDI, and vice versa.Over the past twenty years, many states have made significant cuts to their WC programs. Benefits have declined, as have the number of injuries covered by WC. Not surprisingly, these cuts have coincided with a decline in the number of WC beneficiaries and a proportionate increase in the number of SSDI beneficiaries.[4]
If the number of beneficiaries in these two programs is combined, there is almost no change from 2000 to 2011 in the percentage of the workforce getting benefits. (Our data on WC recipients only go through 2011.) Furthermore, if we include the impact of changing demographics on the number of SSDI beneficiaries, the share of the workforce receiving benefits has actually declined, as shown in Figure 2.[5,6] (Note that the age- and sex-adjustment only applies to the number of workers receiving SSDI, as the data on WC beneficiaries do not include demographic breakdowns.)
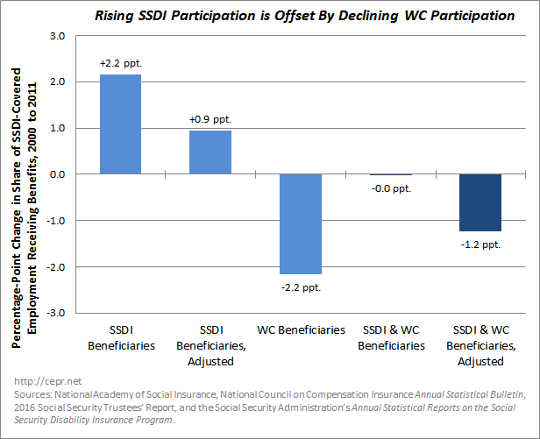 Figure 2
In short, there has been no increase in the share of the SSDI-eligible population living off some form of disability benefits over this period. Moreover, there has actually been a drop if we take into account the impact of changing demographics.Finally, it is worth mapping the trend depicted in Figure 2 onto more recent years. Unfortunately, as stated earlier, our data on the number of WC recipients only go through 2011. Figure 3-1 shows the number of WC and SSDI beneficiaries as a share of the SSDI-eligible population from 2000 to 2015; for the years 2012 through 2015, it is assumed that either the number of workers receiving WC benefits (the dashed line) or the percentage of workers receiving WC benefits (the dotted line) hasn’t changed since 2011. If one of these assumptions is true, then the share of the workforce receiving some form of disability benefits would’ve fallen between 0.14 and 0.31 percentage-points between 2000 and 2015.[7]

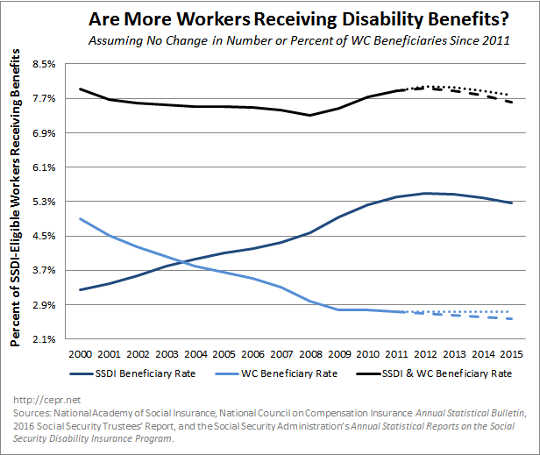 Figure 3-1
But the assumption made in Figure 3-1 is likely too generous; after all, the number of WC beneficiaries fell every single year between 2000 and 2011. Figure 3-2 shows the number of WC and SSDI beneficiaries as a percentage of the SSDI-eligible population under the assumption that the number (the dashed line) or share (the dotted line) of WC recipients continued falling at the same rate from 2011-2015 as during the previous 11 years. Using this set of assumptions, the share of the workforce receiving either WC or SSDI would’ve fallen 0.93 to 1.01 percentage-points.
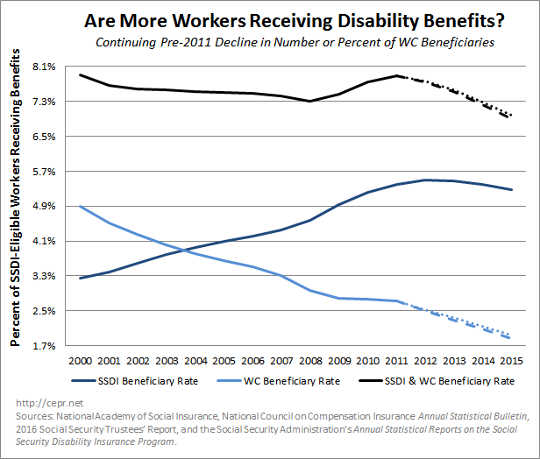 Figure 3-2
The number of workers receiving disability benefits has fallen over the past 15 years, though we can’t say by how much. The decrease may be comparable to a rounding error (0.14 percentage-points), or it may be rather large (1.01 percentage-points). But even if we don’t know the size of the decrease, we can be certain that at least some decrease has occurred – and this should put a real dent in the “SSDI recipients as takers” argument. Prominent conservative pundits have argued that the drop in employment since 2000 is driven in large part by the fact that more Americans are choosing to take disability benefits rather than work. Those who use this argument are engaging in serious cherry-picking: they are highlighting the program with rising enrollment (SSDI) while ignoring the program with declining enrollment (WC). When both programs are examined together, there is no apparent increase in the number of Americans receiving benefits.
This article originally appeared on CEPR
References
[1] Another source of rising SSDI enrollment is the increase in Social Security’s “full retirement age”. When SSDI beneficiaries hit full retirement age, they stop receiving SSDI benefits and start receiving normal Social Security retirement benefits. This means that the one-year increase (from 65 to 66) in Social Security’s full retirement age has kept many disabled workers on SSDI for an extra year. Between 2000 and 2014, the number of 65-year-old SSDI beneficiaries went from zero to 467,000; this accounts for 11.9 percent of the increase in SSDI beneficiaries during this time.
[2] An extensive work history is required in order to become eligible for SSDI benefits. For a full description, see pg. 20-21 of this CEPR report, “Benefits Planner: Social Security Credits” at the Social Security Administration (SSA) website, and this SSA pamphlet. The SSDI beneficiary rate is calculated by dividing the number of SSDI recipients by the number of people eligible for benefits.
[3] The demographic adjustment is based on data presented in Table V.C5 on page 141 of the 2016 Social Security Trustees’ Report.
[4] To determine the number of WC beneficiaries, data are drawn from two sources: the Annual Statistical Bulletin published by the National Council on Compensation Insurance (NCCI), and various annual reports on WC published by the National Academy of Social Insurance (NASI). NCCI’s Annual Statistical Bulletin provides data, by state, on the number of WC beneficiaries per 100,000 covered workers. By combining NCCI’s data with NASI’s data on the number of covered workers, we are able to determine the number of WC beneficiaries in each state in any given year. However, because NCCI’s data do not cover North Dakota, Ohio, Washington (state), West Virginia, and Wyoming, it is assumed that the take-up rate among covered workers in those states is the same as the average take-up rate for workers in the other 45 states and DC.
[5] The number of workers taking some form of disability benefits is less than the sum of “WC beneficiaries plus SSDI beneficiaries”. This is because a small number of people – between 361,000 and 401,000 per year between 2000 and 2011 – actually receive benefits from both programs. In order to not double-count people benefiting from both WC and SSDI, the number of people receiving some form of benefits is calculated as follows: (WC Beneficiaries) + (SSDI Beneficiaries) – (Dual Beneficiaries) = (Total Number of Beneficiaries).
[6] Data on the number of dual beneficiaries for the years 2000-2002 are drawn from the 2001, 2002, and 2003 NASI reports on WC coverage. Unfortunately, beginning with NASI’s 2004 paper, the reported number of dual beneficiaries includes people utilizing a third (relatively minor) disability program known as “public disability benefits”. Therefore, post-2002 data come from the Social Security Administration’s Annual Statistical Reports on the Social Security Disability Insurance Program. The number of dual beneficiaries is drawn from Table 31. Because Table 31 includes SSDI dual beneficiaries whose second disability program can be either WC or public disability benefits, the number of WC-SSDI dual beneficiaries is calculated as follows:All workers receiving both WC and SSDI (lines 7-12) are included;All workers receiving both SSDI and public disability benefits (lines 13-16) are excluded;All workers receiving WC, SSDI, and public disability benefits (lines 17-20) are included;For workers listed in lines 21-23, it is assumed that the same percentage of these workers receive both SSDI and WC as was divined from lines 7-20;All workers with pending WC or public disability benefit applications (line 24) are excluded, since they are not receiving benefits at the time. This formula gives us a close approximation for the number of WC-SSDI dual beneficiaries for each year from 2005 to 2011. However, because estimates are not available for 2003-2004, there is a gap in the data on dual beneficiaries for those two years. The number of dual beneficiaries for both 2003 and 2004 was determined by a process of linear interpolation linking the 2002 NASI data with the 2005 Social Security Administration data.
[7] For the year 2012, the number of dual beneficiaries is calculated according to the methodology outlined in footnote number six. However, beginning in 2013, the Social Security Administration changed how it presents data on the number of dual beneficiaries. For the years 2013-2015, the number of dual beneficiaries (as determined from Table 31) has been calculated as follows: All workers receiving both WC and SSDI (lines 9-12) are included; All workers receiving both SSDI and public disability benefits (lines 14-16) are excluded; All workers receiving WC, SSDI, and public disability benefits (lines 17) are included; For workers listed in lines 18 and 20, it is assumed that the same percentage of these workers receive both SSDI and WC as was divined from lines 9-17; All workers with pending WC or public disability benefit applications (line 21) are excluded, since they are not receiving benefits at the time.
About The Author
Nick Buffie graduated with a B.A. in Economics and Hispanic Literatures and Cultures from Wesleyan University. His main areas of interest include economic inequality, depressions, and equality of opportunity. Much of his research focuses on unemployment, healthcare reform, tax policy, labor policy, the public budget, and regulation of the financial sector. Nick has previously worked at Economic Policy Institute, the National Hispanic Caucus of State Legislators, and the U.S. House of Representatives.
Related Books
at InnerSelf Market and Amazon

 Affairs")